
DevTools-grade UI
Pixel-faithful Chrome DevTools typography and palette,
with official light & dark themes.
✨ Built on eruda, benchmarked against Chrome DevTools — bilingual UI, network blocking/rewriting/mocking/throttling, HAR import & export
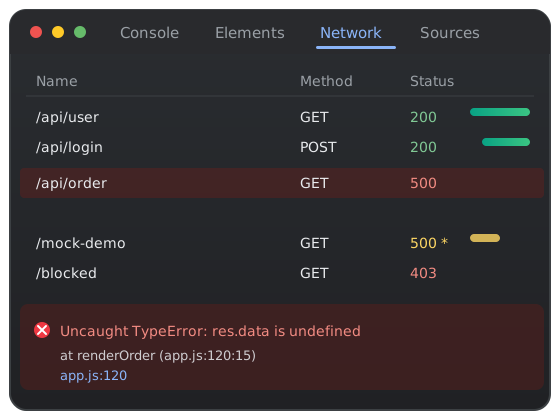
This section is the real eruda-plus — not a screenshot, not an iframe. Once the page loads, an eruda floating ball appears at the bottom-right corner; tap it to open the full console, elements and network panels. Unfold the "测试" (Test) dropdown below to simulate logs, errors, slow networks and mocks, then inspect the results inside the panels.
Best viewed on a phone (or mobile emulation)
eruda-plus is designed for touch-first mobile screens but works fine on desktop too. Long-press and drag the floating ball if it overlaps your content.
One script tag gives any mobile page a full console:
<script src="//cdn.jsdelivr.net/gh/masgzy/eruda-plus@0.2.0/dist/eruda.js"></script>
<script>eruda.init()</script>
Or install from npm:
npm install eruda-plusimport eruda from 'eruda-plus'
eruda.init()
// Need blocking / mocking / throttling?
const network = eruda.get('network')
network.block('/api/private')
network.mock({ url: '/api/user', response: { status: 500, body: '{"err":1}' } })Read the Getting Started guide and the feature walkthrough for more.
eruda gave mobile pages a console; eruda-plus asks whether it is actually good to use: does it look like DevTools, can Chinese users read it, can you simulate offline or slow networks, can you archive issues from the field. To that end we rewrote most of the network panel, adopted the DevTools design language across the UI, and filled in the daily essentials — error stacks, HAR, request editing. The full evolution plan lives in the roadmap.
An all-round enhancement for mobile debugging